Friday, April 11, 2014
How to avoid BLANKS errors in CHARTS
Prerequisite
Able to use/create charts in Excel. Know how to use "ISERROR" formula. Please refer to Microsoft help for Syntax.
Possible Usage
To reflect a clean and accurate in formation in charts.
For example, refer to the table below.
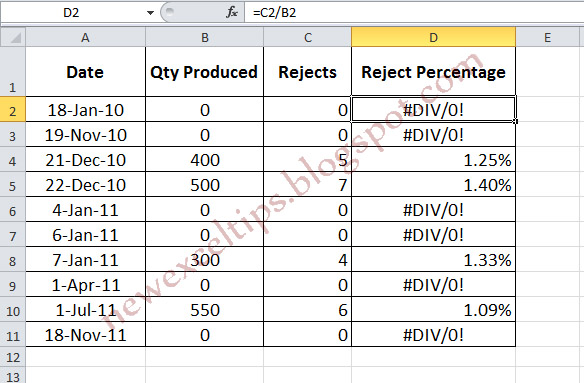
For example, refer to the table below.
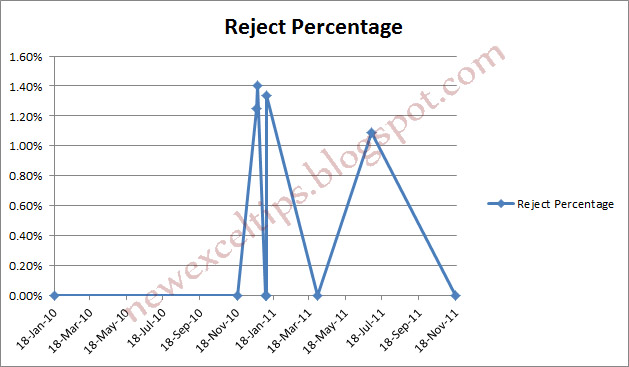
If we plot Reject Percentage Vs Date we will get,
First the chart is not accurate as there was no production in certain days and reject rate cannot be considered "Zero".
Second the chart is not tidy.
The steps (How to do)
1. type =IF(ISERROR(C2/B2)=TRUE,#N/A,C2/B2) in D2
2. Drag or Copy/Paste all the necessary cells
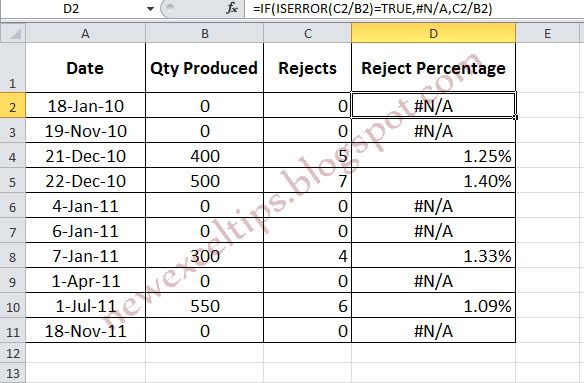
DONE
2. Drag or Copy/Paste all the necessary cells
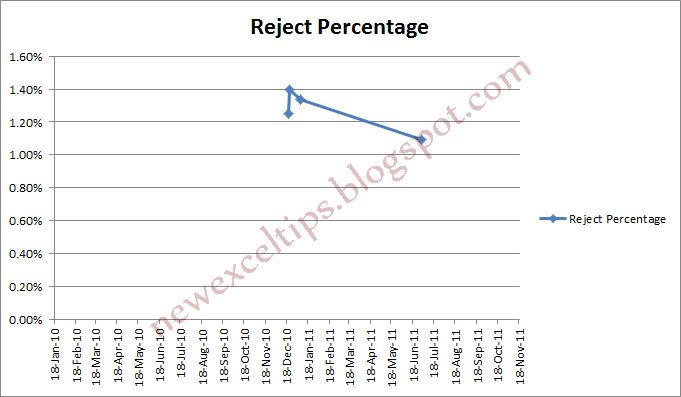
3. We will get a clean and accurate chart
DONE
alternative link download
Subscribe to:
Post Comments (Atom)
No comments:
Post a Comment
Note: Only a member of this blog may post a comment.